

SCO newsletter | James Gardiner | September 2026
Australian cinema attendance is improving. The quieter weeks are stronger, more visits are being made, and there is good reason to feel more confident than we did a year ago. But the recovery in box-office revenue is still well ahead of the recovery in visits. For a cinema owner facing a major equipment bill, that distinction matters.
In May, I wrote about the early lift in Australian attendance. We now have a fuller picture, including a closer look at extended cinema experiences. My view is cautiously optimistic about cinema-going, but considerably more careful about what that means for each cinema business.
J. Sperling Reich posed a similar question in Celluloid Junkie’s September article, “Movie Theatres Had a Record Summer. So Why Is Everyone Still Worried?” A successful season and an unresolved business model can coexist. For SCO readers, the useful test is what the Australian numbers tell us. [1]
The quieter weeks are the encouraging part
Across the first 38 populated weeks in our workbook, Australian admissions are 17.0% ahead of 2025. The improvement is spread across 27 of those 38 weeks. [2]
| First 38 weeks | 2025 | 2026 | Change |
|---|---|---|---|
| Box office | A$715.6m | A$890.8m | +24.5% |
| Admissions | 40.2m | 47.0m | +17.0% |
| Revenue per admission | A$17.80 | A$18.94 | +6.4% |
The weakest complete five-week stretch improved from an average of about 586,000 admissions a week to 772,000, an increase of 31.7%. Weeks below 750,000 admissions fell from nine to five. That gives us more reason for confidence than a single blockbuster weekend.
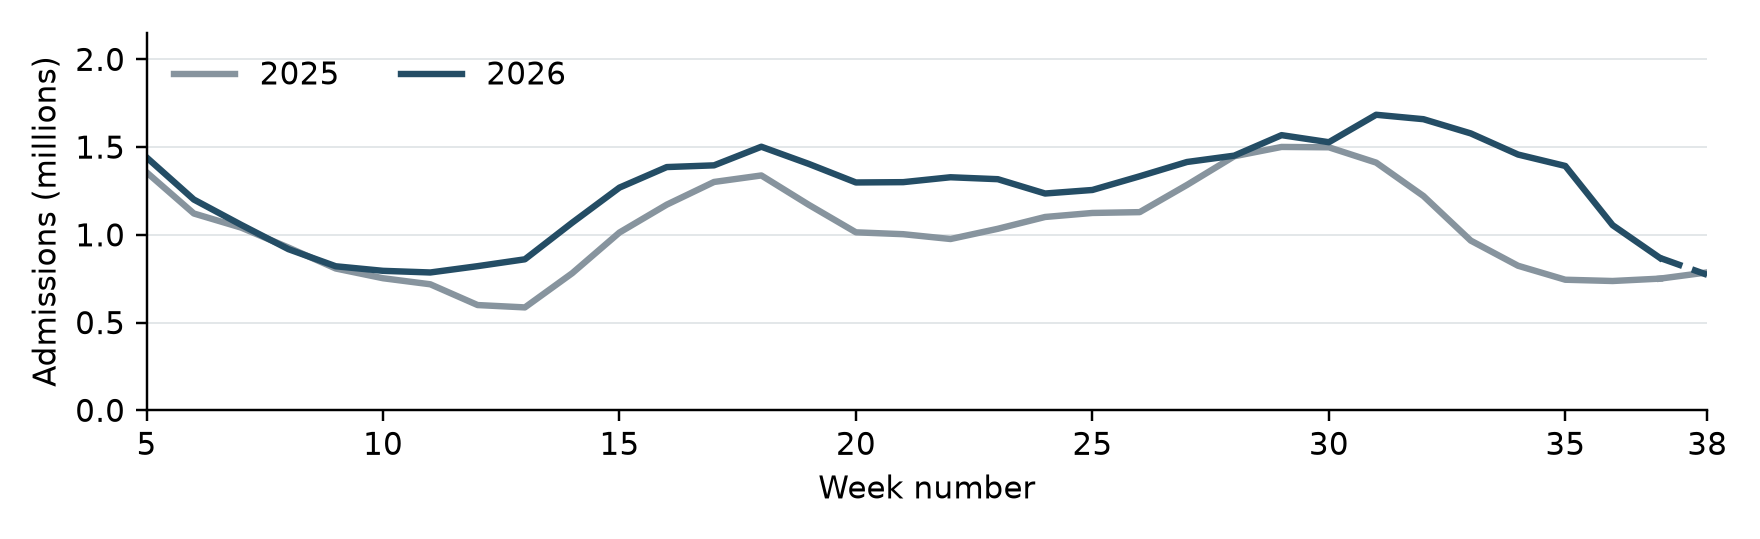
Australian attendance through week 38 using a trailing five-week average. Source [2].
This is consistent with cinema returning to more people’s leisure plans. It is not proof that a lasting habit has formed: film availability, release timing and school holidays also affect the quieter periods. Admissions count visits, so these figures cannot separate returning customers from existing customers going more often.
The recent peaks show why box office can mislead
The two graphs below make the difference between then and now particularly clear. They compare box office and admissions with the average of 2018 and 2019, the pre-pandemic benchmark used in the spreadsheet. The shaded section covers weeks 26–38, roughly the latest three months of available figures. [2]
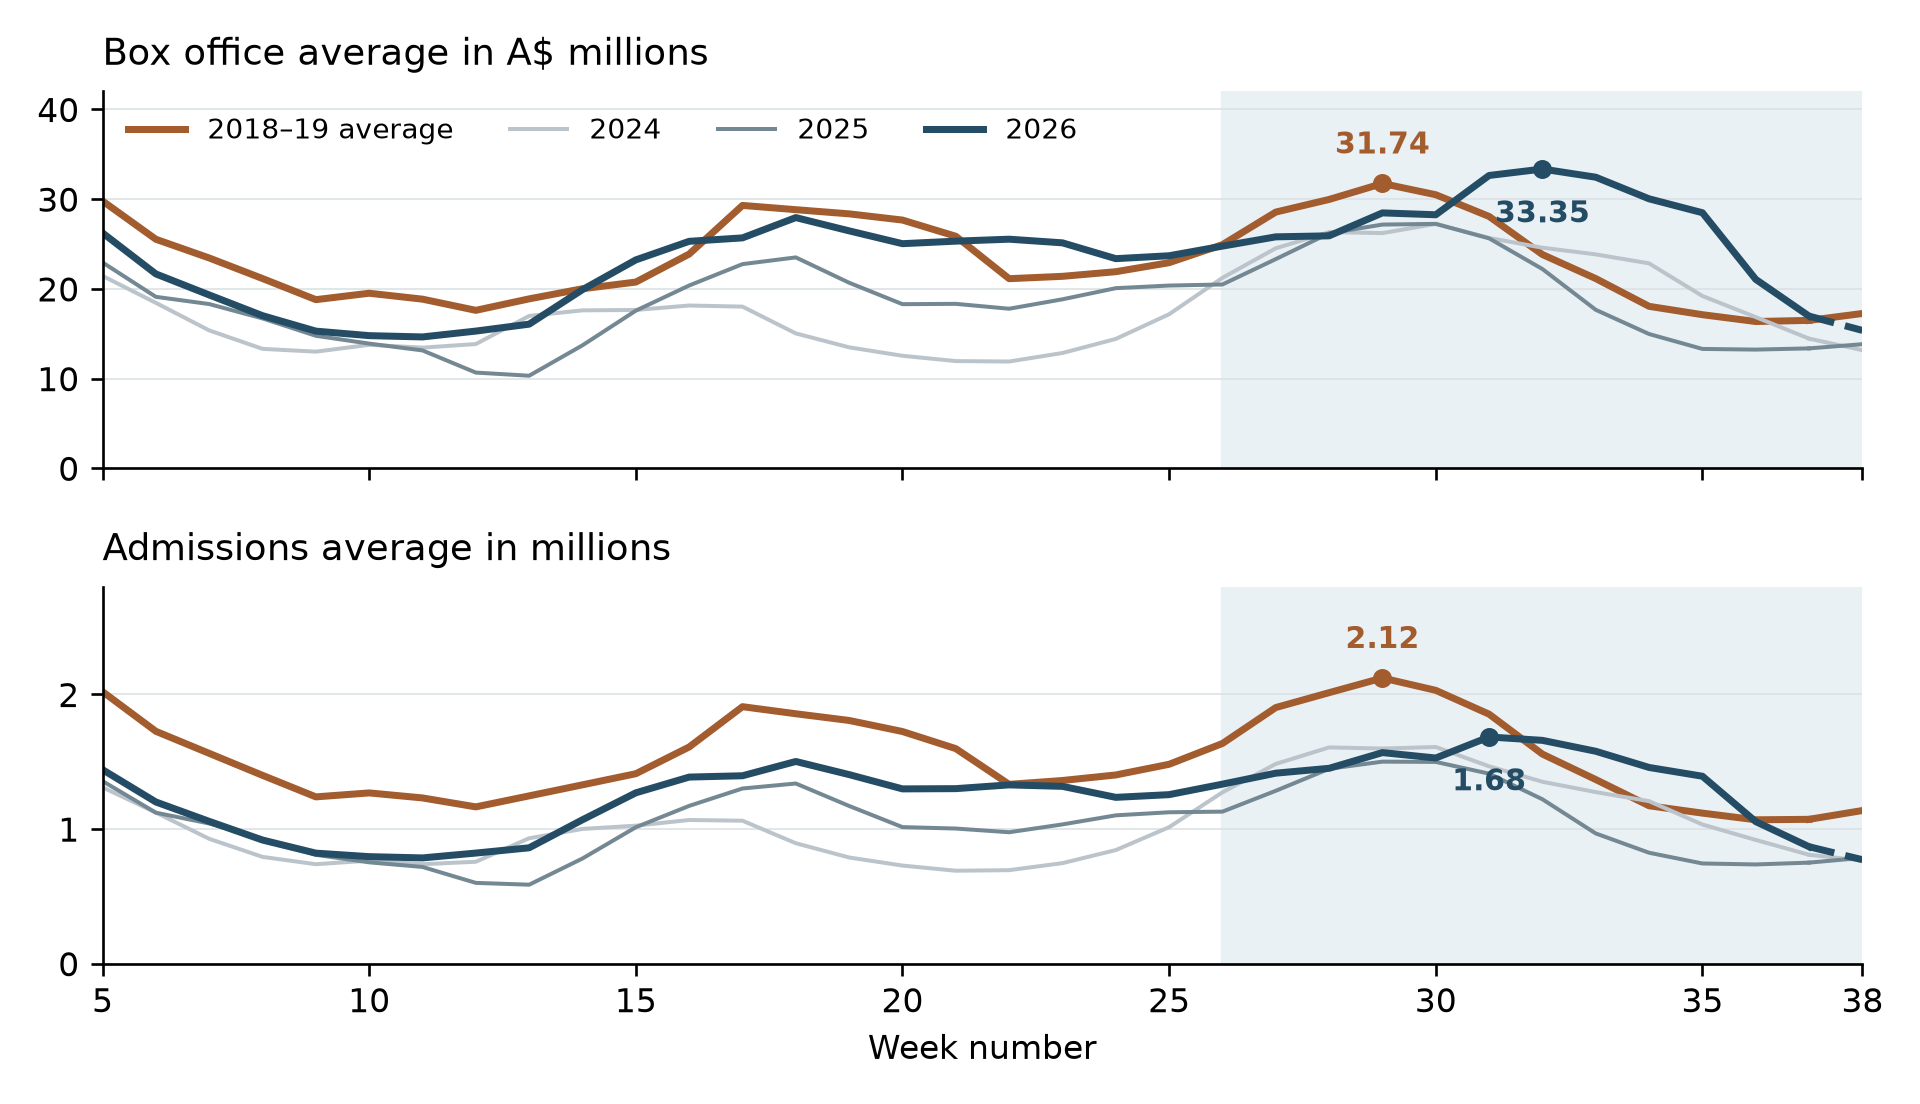
Trailing five-week averages from SCO data analysis. Shading marks weeks 26–38; labels mark each series’ peak within that window.
Within that recent window, the 2026 five-week box-office average peaked at A$33.35 million, above the pre-pandemic benchmark’s peak of A$31.74 million. Yet the 2026 attendance peak was only 1.68 million visits a week, against 2.12 million before the pandemic: about 21% lower. These are each series’ peaks within the window, not necessarily the same week.
Across all 13 weeks, box office was 11.3% above the 2018–19 average, while admissions were 13.7% below it. Average revenue per admission was A$19.48, compared with A$15.11, an increase of 29.0%. Higher revenue per ticket therefore explains how fewer visits can produce a box-office result that looks better than the pre-pandemic market.
That is revenue, not profit. Inflation and changes in prices, discounts and the mix of films and ticket products can all contribute; these figures do not isolate their individual effects. Higher wages, energy and other costs may also absorb the extra revenue. We should not read a record in nominal dollars as evidence that attendance or profitability has recovered to the same degree.
The distinction is the comparison being made. Attendance has genuinely improved against 2025. Against the pre-pandemic benchmark, the recent apparent recovery in box office relies on higher revenue per visit rather than a return to the earlier volume of visits.
Cinema has recovered further in dollars than in visits
Through the same 38 weeks, box office reached A$890.8 million, just 1.1% below the comparable 2019 period. Admissions were 47.0 million, still 20.0% below 2019. Those are very different descriptions of the same market. The dollar comparison is also before inflation. [2]
Average ticket revenue rose from A$17.80 in 2025 to A$18.94 in 2026. In the last five populated weeks, box office was 11.1% higher than the matching 2025 period while admissions were 1.8% lower. It illustrates why owners should track visits alongside revenue.
The ticket-price sheet also records seven 2026 weeks with average ticket revenue at or above A$20, compared with none in the first 38 weeks of 2025. Prices, discounts, film and audience mix, and premium products can all affect that average. We cannot assign the increase to one cause.
Streaming remains popular but its value is being questioned
My starting question was whether cinema had become more attractive because streaming was becoming less satisfying. The evidence supports a narrower version of that idea.
Australians have certainly not abandoned streaming. ACMA reports that 91% of adults watched online video in a typical week in 2025, and 68% used paid subscription streaming. Telsyte found that 46% of subscription-video users were rotating services more often to manage costs. That is evidence of active price and value decisions; it does not establish that those people then bought cinema tickets. [3–4]
There is also a difference between having plenty available and finding something worth watching. ACMA’s data for five major services show spending on Australian programs rose from A$341 million to A$414 million in 2024–25, while the number commissioned or co-commissioned fell from 55 to 41. One substantial feature-film investment helped drive the spending increase. This describes a concentration of investment, not a measurement of quality or the whole global catalogue. [5]
My concern about the creative process remains. People working with detailed audience measurements will carry that knowledge into decisions about what to make. The algorithm does not need a seat in the meeting to influence the discussion. The risk is that a clear creative vision becomes harder to defend when every decision must resemble something that has already measured well.
The same concern applies to casting. If recognisability or online reach receives too much weight, chemistry and credibility can suffer. That is an editorial concern, not evidence that acting has become universally worse. Films such as The King’s Speech remind us why a well-told story and convincing performances can make an occasion without requiring a giant franchise.
Short seasons, long gaps and stories cancelled before resolution can also make audiences reluctant to invest emotionally. They may leave less time for the conversation that builds a following. We should question whether the pursuit of immediate viewing sometimes works against lasting fandom, without claiming that every platform follows a fixed cancellation rule.
For cinemas, the opportunity is to make choosing a film and enjoying it feel worthwhile. Streaming frustration alone will not bring customers through the door; compelling films, useful local recommendations and a good visit still have to do that work.
Extended experiences earn more from selected event films
We have broadened our Comscore analysis beyond IMAX. “Extended experiences” now includes every separately reported format other than plain 2D and 3D: IMAX, MXP, EXPN_2D and 70mm. It is a working category for the added experiences we want to examine, including products that may be difficult for smaller independents to offer. [6]
Across 14 leading 2026 releases, captured on 22 September, these formats earned A$36.34 million: 7.34% of the sample’s A$494.9 million box office from 4.38% of its reported admissions. Their average revenue per reported admission was A$33.25, compared with A$19.22 for plain 2D and 3D combined, about 73% higher. The appendix gives the full film table and the treatment of one missing admissions entry.
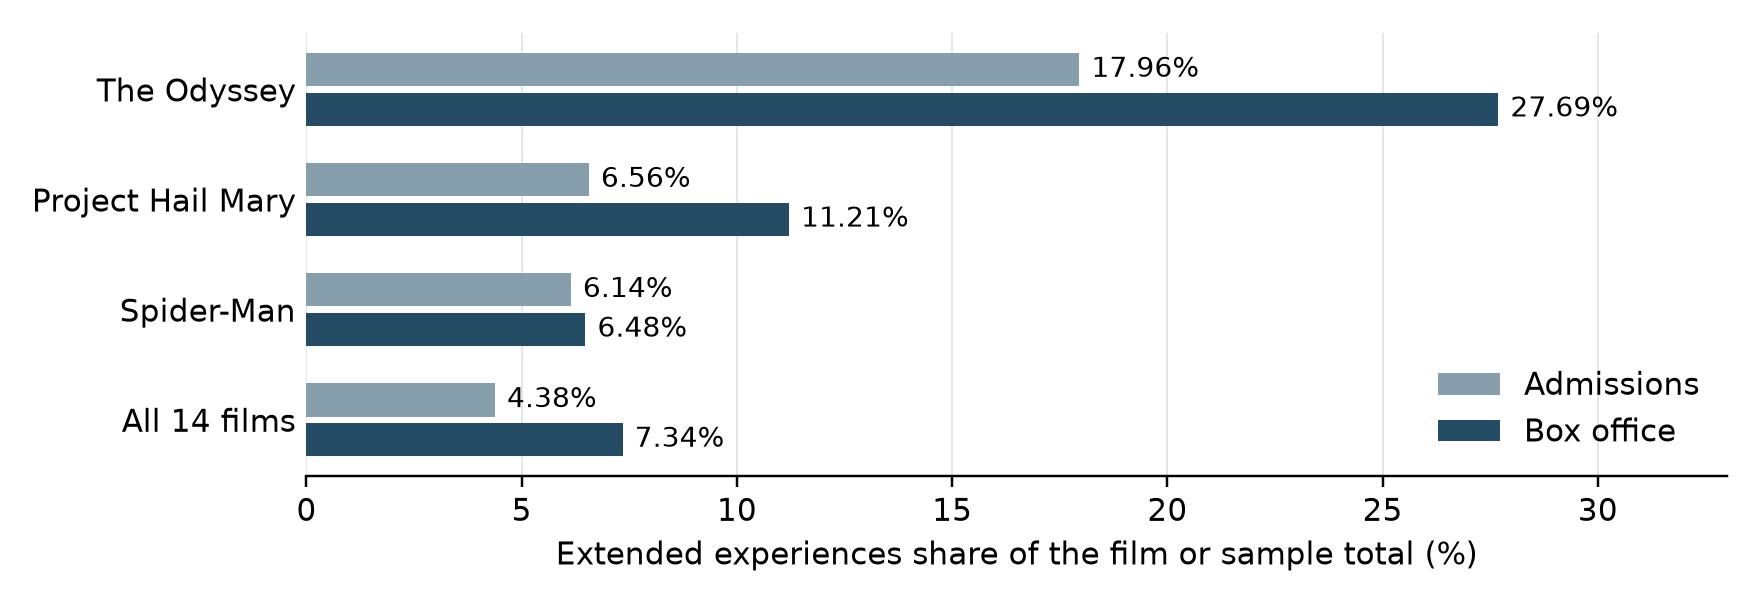
Selected comparisons and the weighted 14-film total. All separate formats except plain 2D and 3D; reported admissions only. Australian cumulative results captured 22 September 2026. Source [6].
The broader definition reveals more activity, including Spider-Man: Brand New Day’s A$5.62 million outside plain 2D and 3D despite no separate IMAX row in its capture. The Odyssey earned 27.69% of its revenue through extended experiences and supplied 50.6% of the sample’s extended-experience revenue. Together, The Odyssey, Spider-Man and Project Hail Mary supplied 78.3%. Excluding The Odyssey, the category’s revenue share falls to 4.19%.
This strengthens the case that operators with suitable products can earn disproportionately more from selected event films. But plain 2D and 3D still supplied 92.66% of sample revenue and 95.62% of reported admissions. The data do not show that most cinema demand has moved to extended experiences, or that these formats account for most of the national recovery.
The labels also have limits. A 2D row may contain premium seats or chain products that were not reported separately. Conversely, the pooled MXP 3D yield was below the baseline. Our category is therefore not a verified list of higher-priced tickets or products unavailable to independents. Event Cinemas’ premium seating across Original and V-Max illustrates why presentation format and ticket product need to be distinguished. [7]
For smaller operators, the concern is that a strong national revenue headline may include opportunities they cannot readily reproduce. This sample makes that concern worth investigating; it does not measure the gap between chains and independents. The practical response is to test investment against a cinema’s own visits, achievable revenue per visit and costs. A higher ticket yield alone does not establish a higher profit.
A cheaper outing still has to compete with staying home
Household pressure offers another possible explanation for cinema’s improvement, but it cuts both ways. Australia experienced seven consecutive quarters of falling GDP per person before a small increase in December 2024. That prolonged per-capita downturn is a more accurate reference point than loosely declaring the country to be in recession. [8]
A household postponing a holiday may still want an evening out locally. Cinema can benefit from that substitution. We do not, however, have evidence showing how much of the 2026 attendance increase came from money diverted from travel.
Nor should we rely on the old description of cinema as recession-proof. Streaming changes the calculation. A household under serious pressure can keep a subscription and avoid the additional cost of tickets, food and transport. Telsyte found that 47% of subscription-video users regarded their service as non-negotiable. Cinema may be cheaper than many outings, but it is no longer the last entertainment expense standing. [4]
That makes the attendance improvement encouraging: customers are choosing an additional outing despite abundant entertainment at home. It also means value and local affordability remain important, even while premium tickets attract attention.
ICA identifies a capital problem that growth may not fix
ICA’s Digital Mark II research should be read alongside the recovery figures. It models equipment renewal using 2025 box office, an indicative A$100,000 replacement cost per screen and several operating-margin assumptions. In its central 5% margin case, 129 independent cinemas covering 318 screens need at least five years of modelled operating profit to fund renewal unaided. Within that group, 66 cinemas and 113 screens need ten years or more. [9]
These are modelled funding burdens, not audited accounts or a forecast that 129 cinemas will close. The use of 2025 trading also means the findings do not measure the benefit of each site’s 2026 improvement. Nevertheless, they identify a substantial group for which ordinary trading may not comfortably fund the next equipment cycle.
The calculation uses full operating profit. In practice, that money also has to meet other demands. Sound, seating, air conditioning, building maintenance, debt and working capital do not stop needing attention when a projector reaches the end of its life.
Borrowing can bridge the timing of a replacement if future cash flow supports repayment. It cannot by itself repair a persistent shortfall between what a cinema earns and what it needs to remain competitive. An owner adding personal savings faces the same underlying question.
My reading is that contraction is a real risk where neither trading improvement nor a sustainable funding arrangement closes that gap. Some venues may need a different ownership, community or operating model. A cinema can have considerable cultural value while being unable to provide the commercial return required of a privately funded business. Those are different funding cases, and both deserve an honest assessment.
Do not invest on the assumption that government will rescue the project
ICA is pursuing support, and there is a legitimate public-interest argument for preserving cinema access in communities that would otherwise lose it. Its September proposal describes ongoing discussions with government. That is a proposal under discussion, not a grant commitment to an individual operator. [10]
The original Virtual Print Fee worked because converting from film to digital created substantial distributor savings that helped finance exhibitors’ conversion. Replacing an ageing digital projector with another digital projector does not create the same new savings pool. The precedent cannot simply be replayed. [9]
For an owner considering investment now, my recommendation is to assume government support is zero unless funding has actually been committed to the project. A future scheme needs a budget, eligibility rules, delivery arrangements and decisions about operator contributions. Its timing may not match a cinema’s equipment failure or cash needs.
Do not take on more debt, commit retirement savings or postpone a difficult ownership decision because assistance feels inevitable. Any eventual grant can reduce the capital burden. It does not automatically fix a cinema that continues to lose money or cannot fund the next cycle of maintenance and renewal.
What would make the recovery more dependable in 2027
I would give more weight to the improvement in ordinary trading weeks than to exceptional revenue from a few releases with extended experiences. But we do not yet know how much of that improvement comes from lasting changes in behaviour and how much depends on the films currently available.
A dependable recovery would show up in stronger admissions through quieter periods, repeat visits and profitable trading across a wider range of films. It would also reach enough individual cinemas to support renewal. Another strong national box-office total would not, on its own, establish any of those things.
For owners, the useful comparison is their own attendance, revenue per visit and cash left after costs. Before approving a major upgrade, test whether the business can fund its full equipment and building needs under ordinary trading conditions and a weaker release year. Include debt repayments and a reasonable return for the owner. National growth is useful context; the site’s own figures must carry the investment case.
Distributors and other businesses that depend on cinemas have a role too. Consistent access to suitable films, workable booking terms and marketing that reaches local audiences can help operators turn occasional visits into repeat business. Where targeted commercial support or a capital partnership makes sense, it should be built around a sustainable venue rather than an assumption that government will eventually pay.
The evidence gives us reason to be more optimistic about cinema-going than we were a year ago. It does not justify budgeting for another 17% rise in attendance, or treating the 2026 extended-experience contribution as permanent.
I would plan around retaining the customers now returning, making each visit worth repeating and funding investment from a business case that works without an unpromised subsidy. That is how an encouraging year can become a more durable recovery for independent cinemas.
James Gardiner
Small Cinema Owners
Appendix: Extended experiences across fourteen major films
Australian cumulative results captured 22 September 2026. Baseline combines plain 2D and 3D. Extended experiences combine all other separately reported formats. Revenue is A$ millions; revenue per admission is A$. Source [6].
Scroll the table horizontally to see all columns.
| Film | Total revenue | Extended revenue | Extended admissions | Extended share of revenue | Extended share of admissions | Baseline revenue per admission | Extended revenue per admission |
|---|---|---|---|---|---|---|---|
| Spider-Man: Brand New Day | 86.78 | 5.624 | 254,776 | 6.48% | 6.14% | 20.85 | 22.07 |
| The Odyssey | 66.45 | 18.398 | 485,310 | 27.69% | 17.96% | 21.67 | 37.91 |
| Michael | 46.49 | 1.997 | 55,381 | 4.29% | 2.42% | 19.93 | 36.05 |
| Toy Story 5 | 46.44 | 0.825 | 24,383 | 1.78% | 0.92% | 17.28 | 33.85 |
| The Devil Wears Prada 2 | 41.95 | 0.125 | 4,512 | 0.30% | 0.23% | 21.11 | 27.69 |
| The Super Mario Galaxy Movie | 39.56 | 1.551 | 44,260 | 3.92% | 2.01% | 17.64 | 35.05 |
| Project Hail Mary | 39.40 | 4.416 | 123,209 | 11.21% | 6.56% | 19.94 | 35.84 |
| Obsession | 25.58 | 0.000 | 0 | 0.00% | 0.00% | 18.38 | n.a. |
| Minions & Monsters | 23.53 | 0.572 | 20,016* | 2.43% | 1.37%* | 15.97 | 27.76* |
| Wuthering Heights | 20.36 | 0.270 | 7,187 | 1.32% | 0.72% | 20.33 | 37.52 |
| Moana (2026) | 16.21 | 0.992 | 29,750 | 6.12% | 3.21% | 16.94 | 33.33 |
| Backrooms | 15.27 | 0.066 | 2,163 | 0.43% | 0.26% | 18.25 | 30.54 |
| Star Wars The Mandalorian and Grogu | 15.00 | 1.498 | 41,195 | 9.99% | 5.98% | 20.84 | 36.36 |
| Goat | 11.88 | 0.009 | 310 | 0.08% | 0.04% | 15.14 | 29.00 |
| All 14 films | 494.90 | 36.342 | 1,092,452* | 7.34% | 4.38%* | 19.22 | 33.25* |
* Reported admissions are incomplete for Minions & Monsters MXP 2D. Its A$16,501 revenue remains in revenue shares but is excluded from the revenue-per-admission numerator. No admissions value has been imputed. Zero means no separate extended-format row was captured, not proof of format availability. Minor per-film revenue rounding can be A$1.
Extended experiences supplied A$36.34 million, or 7.34% of revenue, from 4.38% of reported admissions. Their A$33.25 revenue per reported visit was about 73% above the A$19.22 baseline. This is a pooled comparison across different films and audiences, not an identical-ticket surcharge. The Odyssey supplied half the category’s revenue; together with Spider-Man and Project Hail Mary it supplied 78.3%. The opportunity is commercially meaningful on selected films, while the great majority of reported visits remain in plain 2D and 3D.
The category includes IMAX 2D and 3D, MXP 2D and 3D, EXPN_2D and 70MM. It does not recover chain premium products hidden within 2D, verify that every format has a surcharge, or establish which operators can offer each experience. This snapshot cannot measure changes in customer choice over time or the share of national recovery attributable to these products.
Sources and data notes
All monetary figures in this newsletter are Australian dollars. The national weekly series and the Comscore film sample have different scopes and cutoffs and should not be directly reconciled.
[1] J. Sperling Reich, Celluloid Junkie, The Marquee, 14 September 2026, “Movie Theatres Had a Record Summer. So Why Is Everyone Still Worried?” Newsletter supplied with the research. Referenced for its central industry question, not as a substitute for Australian market data.
[2] Cinema performance per week 2018-2026.xlsx, supplied research workbook. CS_BO Perf, first 38 populated weeks, matched by week number; Ticket Price over time, corresponding 38 weeks. All five-week graphs use each week and its preceding four weeks. The weakest five-week periods are selected separately within each year. The paired box-office and admissions graphs retain the source charts’ 2018–19 average baseline and 2024, 2025 and 2026 comparisons, rebuilt from weekly data as trailing averages. The original workbook uses centred averages; trailing averages avoid shortened windows at the unfinished end of 2026.
For the recent comparison, weeks 26–38 are summed before calculating revenue per admission. The 2018–19 baseline averages the two years’ weekly revenue and admissions separately. Recent five-week peaks occur at week 29 for both baseline series, week 32 for 2026 box office and week 31 for 2026 admissions. The charts retain their different units; line heights are compared within each chart, not across them.
Week 38 contains round values of A$16 million and 750,000 admissions and is treated as potentially provisional. Excluding it, the first 37 weeks still show box-office growth of 25.0% and admissions growth of 17.8% versus 2025. For the recent comparison, weeks 26–37 show revenue 14.1% above the 2018–19 average, admissions 10.9% below and revenue per admission 28.0% higher. Both central findings survive its exclusion.
[3] ACMA, Streaming remains Australia’s favourite way to watch or listen, 5 March 2026. Reports viewing in 2025. Read source
[4] Telsyte, Australians double-down on subscription video as budgets grow to fund more services, 8 October 2025. Australian Subscription Entertainment Study 2025. These findings concern subscription behaviour and stated preferences, not measured substitution into cinema. Read source
[5] ACMA, Data shows increase in subscription video service spending on Australian content, 3 December 2025. Voluntary reporting by Amazon Prime Video, Disney+, Netflix, Paramount+ and Stan; Australian programs in 2024–25. Read source
[6] Comscore Movies, Flash → Film Summary → film Formats, Australia, captured 22 September 2026. The 14 highest-ranked titles with displayed Australian release dates in 2026 were selected from calendar YTD rankings. Cumulative format-table revenue and reported admissions were captured separately. Plain 2D and 3D form the baseline; all other non-Total rows form extended experiences. This replaces the earlier IMAX-only comparison. Minions & Monsters has A$16,501 of MXP 2D revenue with no admissions value: its revenue is included in revenue shares but excluded from yield calculations. Admissions shares use reported counts only. The revised companion report provides the classification, complete table and limitations; the original workbook retains the source transcription but its IMAX calculations use the earlier definition. Current runs and reporting may be incomplete. Read source
[7] Event Cinemas, What does Premium Seating Concepts mean? Premium seating is offered in Original and V-Max auditoriums. This explains why a projection-format label is not a complete classification of ticket products. Read source
[8] ABS, Australian economy grew 0.6 per cent in December quarter, 5 March 2025. Contemporary release reporting a 0.1% increase in GDP per capita following seven consecutive quarterly falls; cited as historical context. Read source
[9] Nick Hayes, Independent Cinemas Australia, Digital Mark II, Research Report v1.0, September 2026. Supplied report, especially executive summary, model description and capital-renewal discussion. Results depend on assumed turnover, margin and equipment costs and do not determine an individual venue’s viability. Read source
[10] Independent Cinemas Australia, ICA proposes national plan to ensure no cinema is left behind, 10 September 2026, public notice published by FilmInk. Describes a proposed co-investment framework and ongoing discussions. Read source
The explanations involving streaming satisfaction, creative incentives and household substitution are interpretations to test. Neither the weekly totals nor the film-format sample establishes those causes. A comparison of 2025 and 2026 at the same cinemas, by verified auditorium product and ownership, would be needed to establish how the recovery is distributed.

One comments
david mcgowanSeptember 25, 2026 at 1:30 pm
E X C E L L E N T ! ..all my thoughts James you’ve nailed it… I’m not a member of ICA and can’t follow their Admin fools …the logic in you’re newsletters is what ICA tottally lacks Cheers David McGowan.